Building permits are the formal approval for construction, issued by local government. They are an indicator of future construction and are used by analysts to track the housing market and local economies. Typically, a dip in housing permit trends means that the economy is struggling. For example, Figure 1 below shows residential housing permits for single-family and multi-family units, with multi-family units broken into categories by size. The chart shows a decrease in residential housing permits that started in 2009 and ended in 2011, directly after the 2008 housing crash and recession.
Contrast the 2009 post-crash decrease with the dramatic spike in housing permits that started in 2019. This growth is dramatic and shows no signs of declining, despite the 2020 pandemic. The chart also shows the building permits issued per every 1,000 persons in the RCA, meaning that the increase in building permits accounts for the increased population. Building activity has increased overall in the RCA. This is the opposite of what one might expect, given the economic impact of the pandemic. However, it is a very positive economic sign for the RCA.
Figure 1: Building Permits per Capita by Type, RCA, 2007-2021
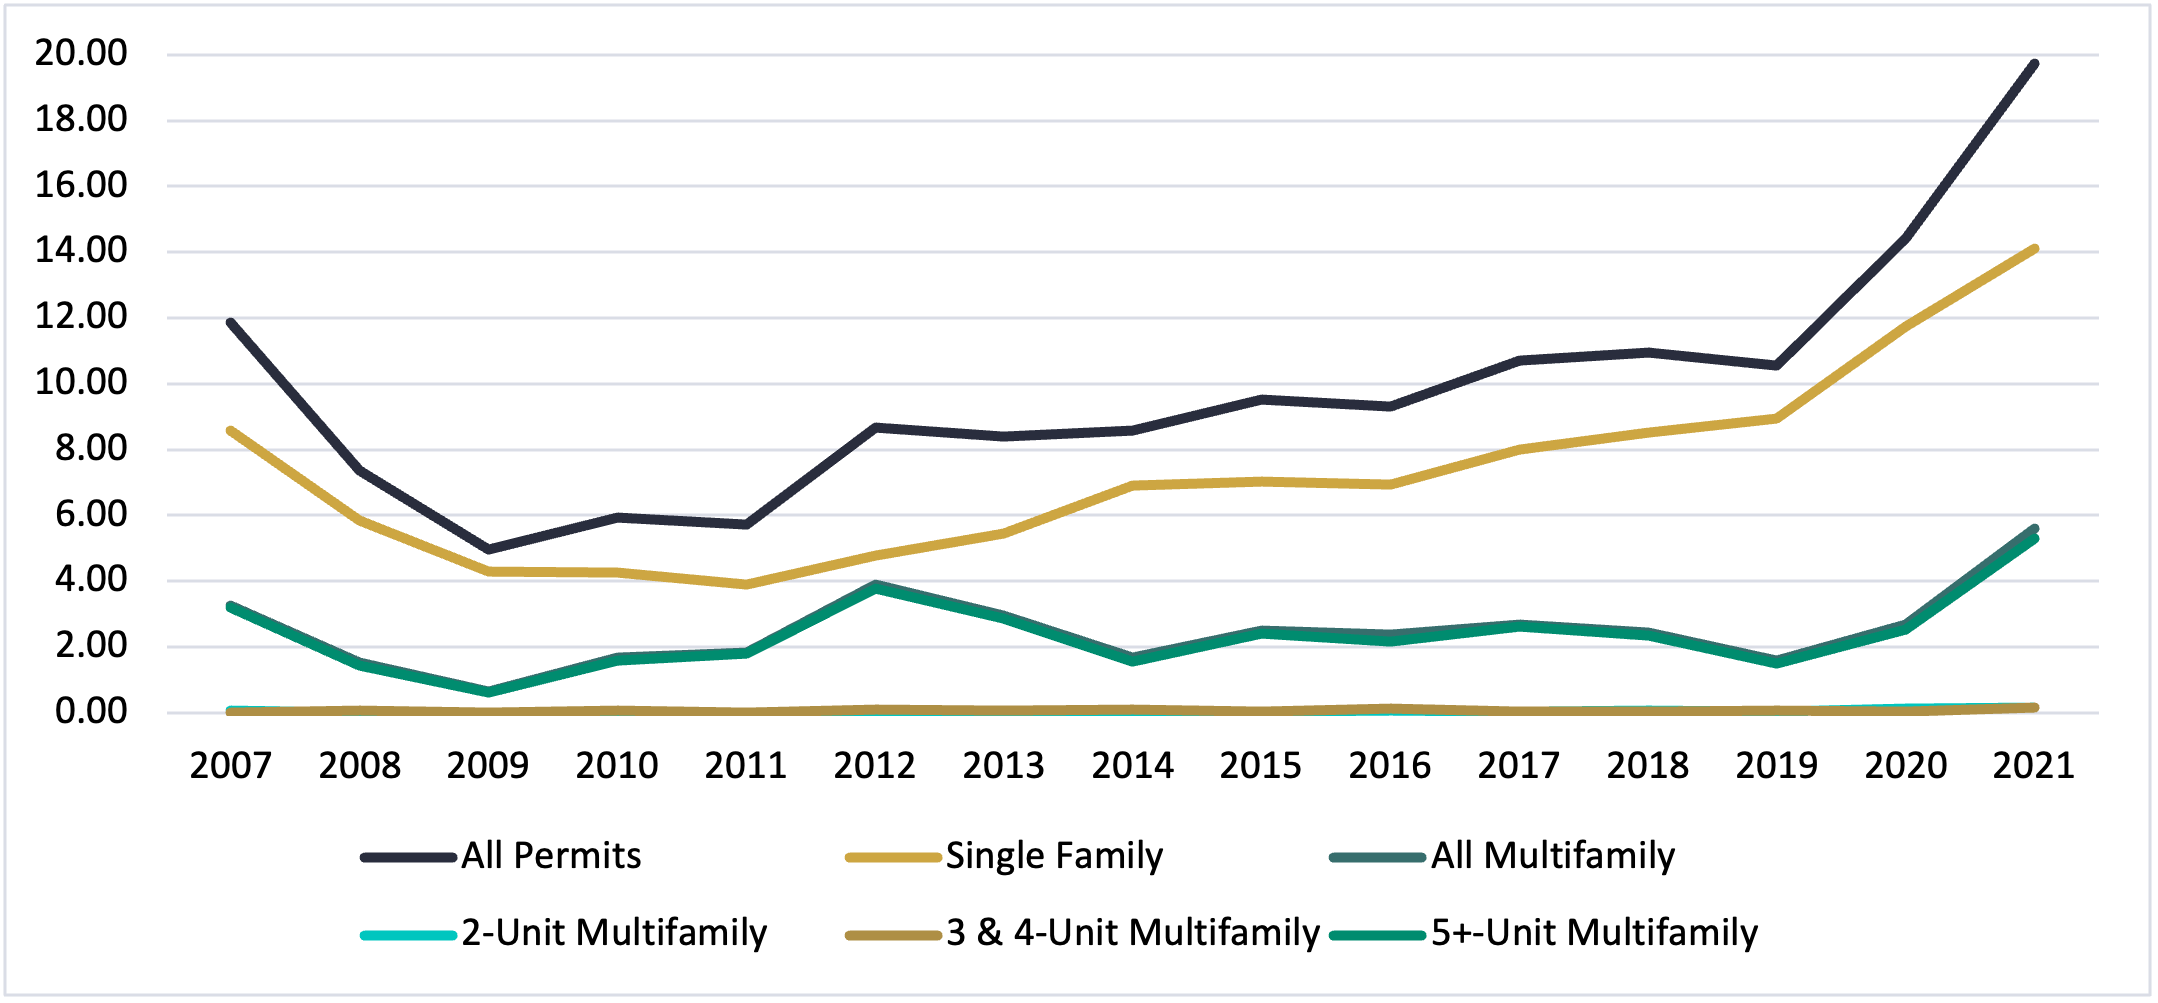
Table 1 shows this information in more detail. Again, even accounting for population change, the number of building permits issued overall increased by 36.7% from 2020 to 2021. This is very similar to the increase from 2019 to 2020 (36.9%) but deviates significantly from 2019’s 3.7% decrease and 2018’s 2.2% increase. Single-family units are the main driver of the growth here, as multi-family permits ticked up, but not at the same rate.
Table 1: All Building Permits Issued in the RCA, 2012-2021
|
Year |
Permits per Thousand |
Housing Permits (all) |
Percent Change |
Percent Change (adjusted for population growth) |
|
2021 |
19.73 |
23,175 |
42.4% |
36.7% |
|
2020 |
14.43 |
16,269 |
43.0% |
36.9% |
|
2019 |
10.54 |
11,380 |
(0.4%) |
(3.7%) |
|
2018 |
10.95 |
11,427 |
5.5% |
2.2% |
|
2017 |
10.72 |
10,827 |
19.1% |
15.2% |
|
2016 |
9.31 |
9,087 |
1.5% |
(2.2%) |
|
2015 |
9.52 |
8,955 |
15.1% |
10.9% |
|
2014 |
8.59 |
7,783 |
5.8% |
2.3% |
|
2013 |
8.40 |
7,359 |
(0.4%) |
(3.2%) |
|
2012 |
8.67 |
7,391 |
54.6% |
51.1% |
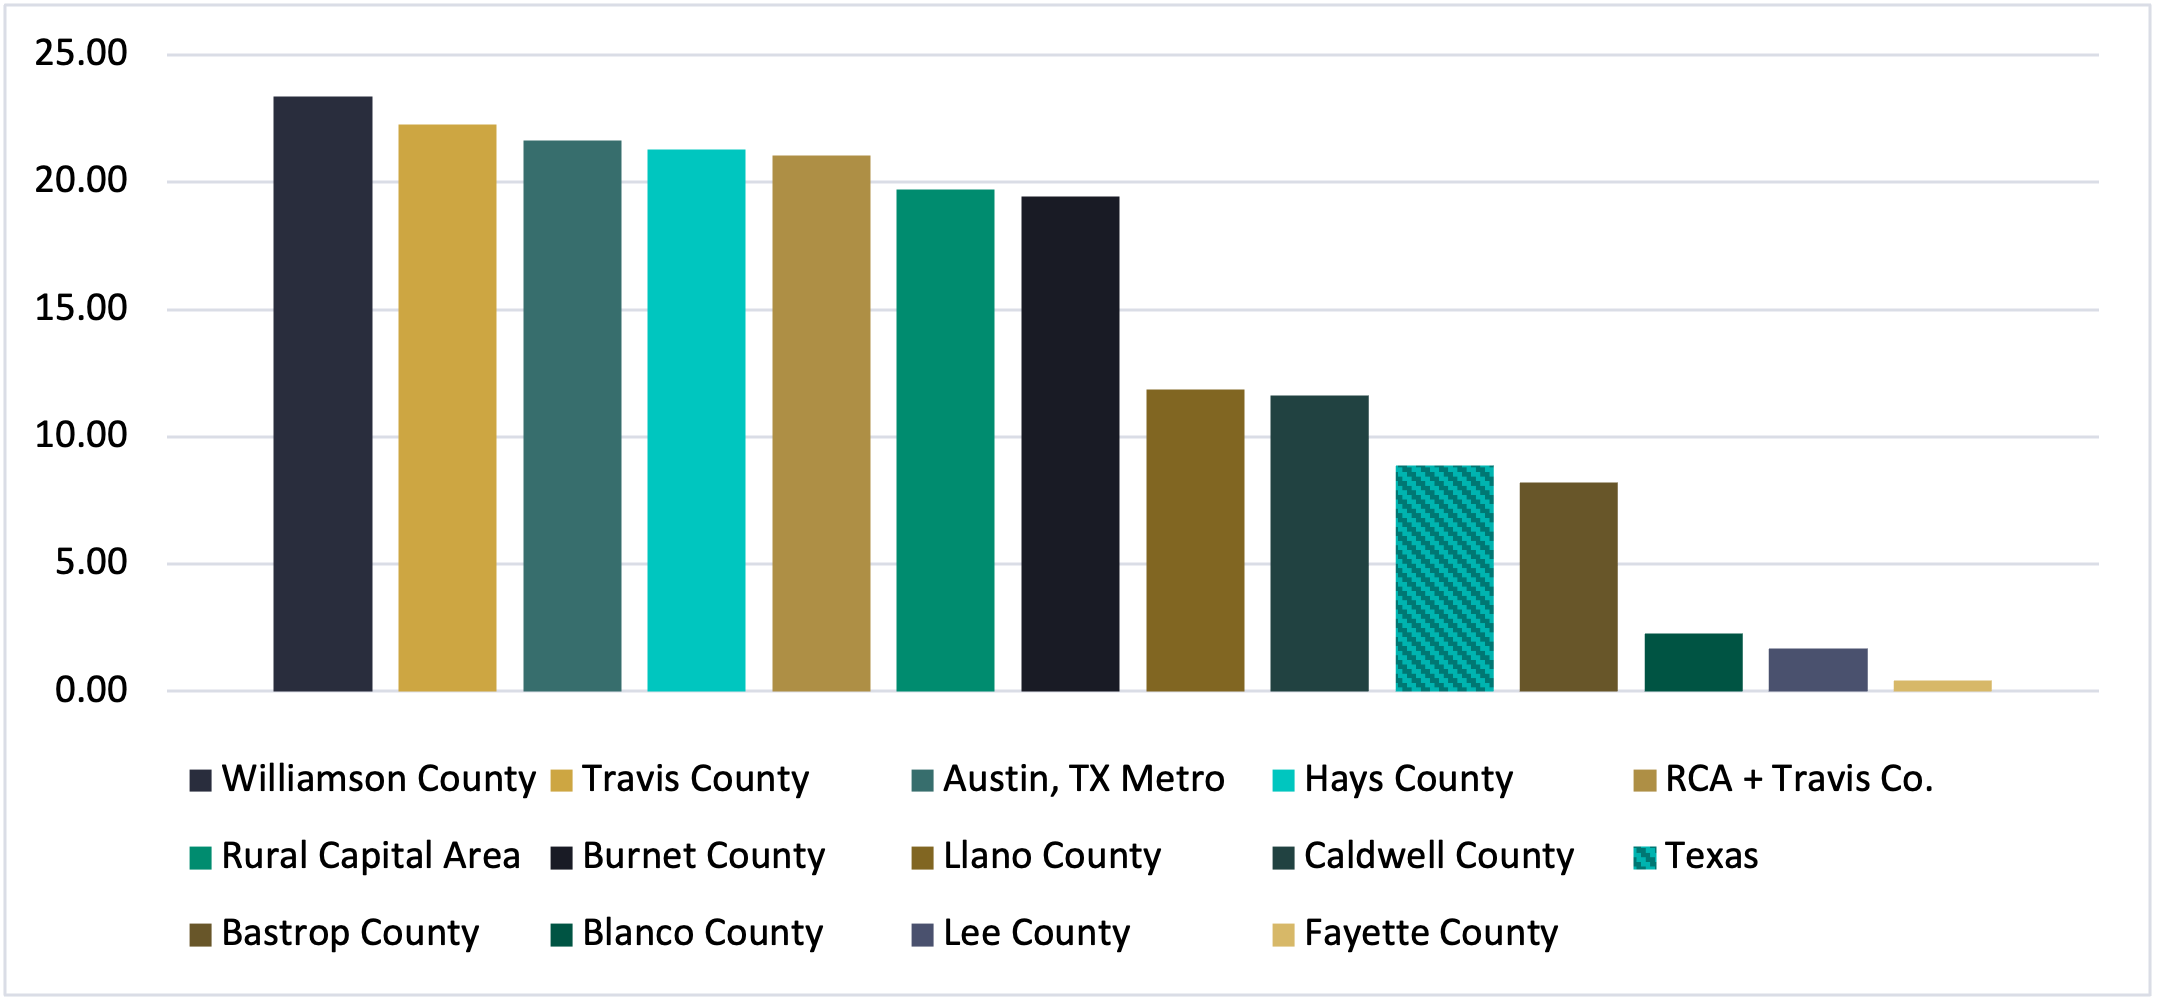
High population counties and counties containing the Austin Metro area led much of the growth. Williamson, Travis, and Hays all exceeded the average number of building permits issued in the RCA as a whole. Notably, five counties in the RCA (Williamson, Hays, Burnet, Llano, and Caldwell) exceed the Texas average of 8.87 permits issued per thousand.
Figure 2: Building Permits per Capita, 2021
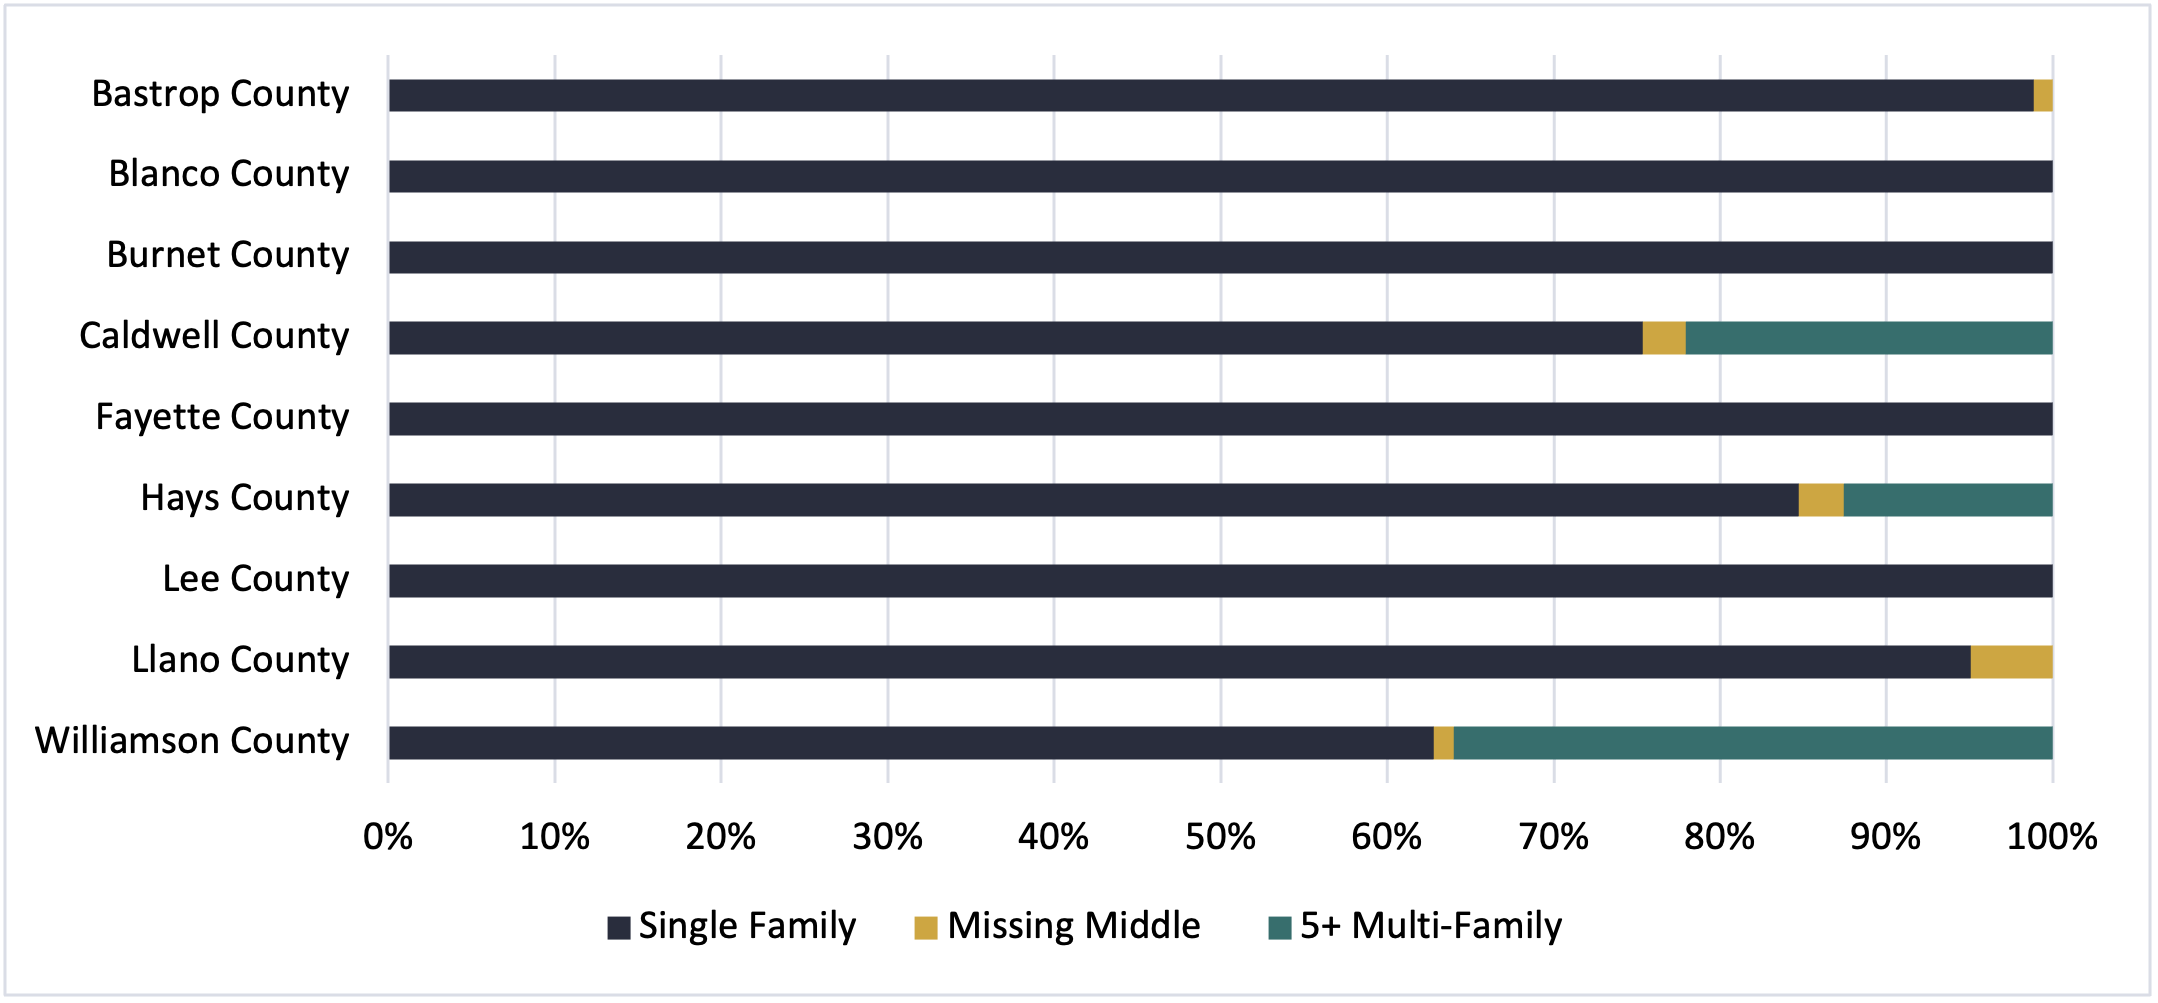
Most permits issued are for single-family homes. Some counties like Blanco, Burnett, Fayette, and Lee issued no permits for multi-family homes in 2021. Furthermore, of the multi-family permits issued across the RCA, almost all were issued for 5+ unit buildings, likely apartments as opposed to multiplexes or townhomes. Despite the increase in building in the RCA, the area is not immune to the problem of “missing middle” housing in the United States. However, increased building activity in the RCA is overall a positive sign.
Figure 3: Single vs. Multi-Family Building Permits per Thousand, RCA Counties, 2021