As defined by the U.S. Census Bureau: “Building permits represent the number of new privately-owned housing units authorized by building permits.” Permits are tracked by various unit sizes or “density” levels. Ensuring the availability of housing that fits the budget and needs of a region’s workforce is a necessity for ensuring a thriving workforce. Within this post, we analyze specific trends for both single-family and multi-family housing units.
The number of authorized units has steadily increased in the last 10 years in both the Austin MSA and the RCA (Rural Capital Area) but the type of units permitted vary greatly whether occurring within the urban or rural areas.
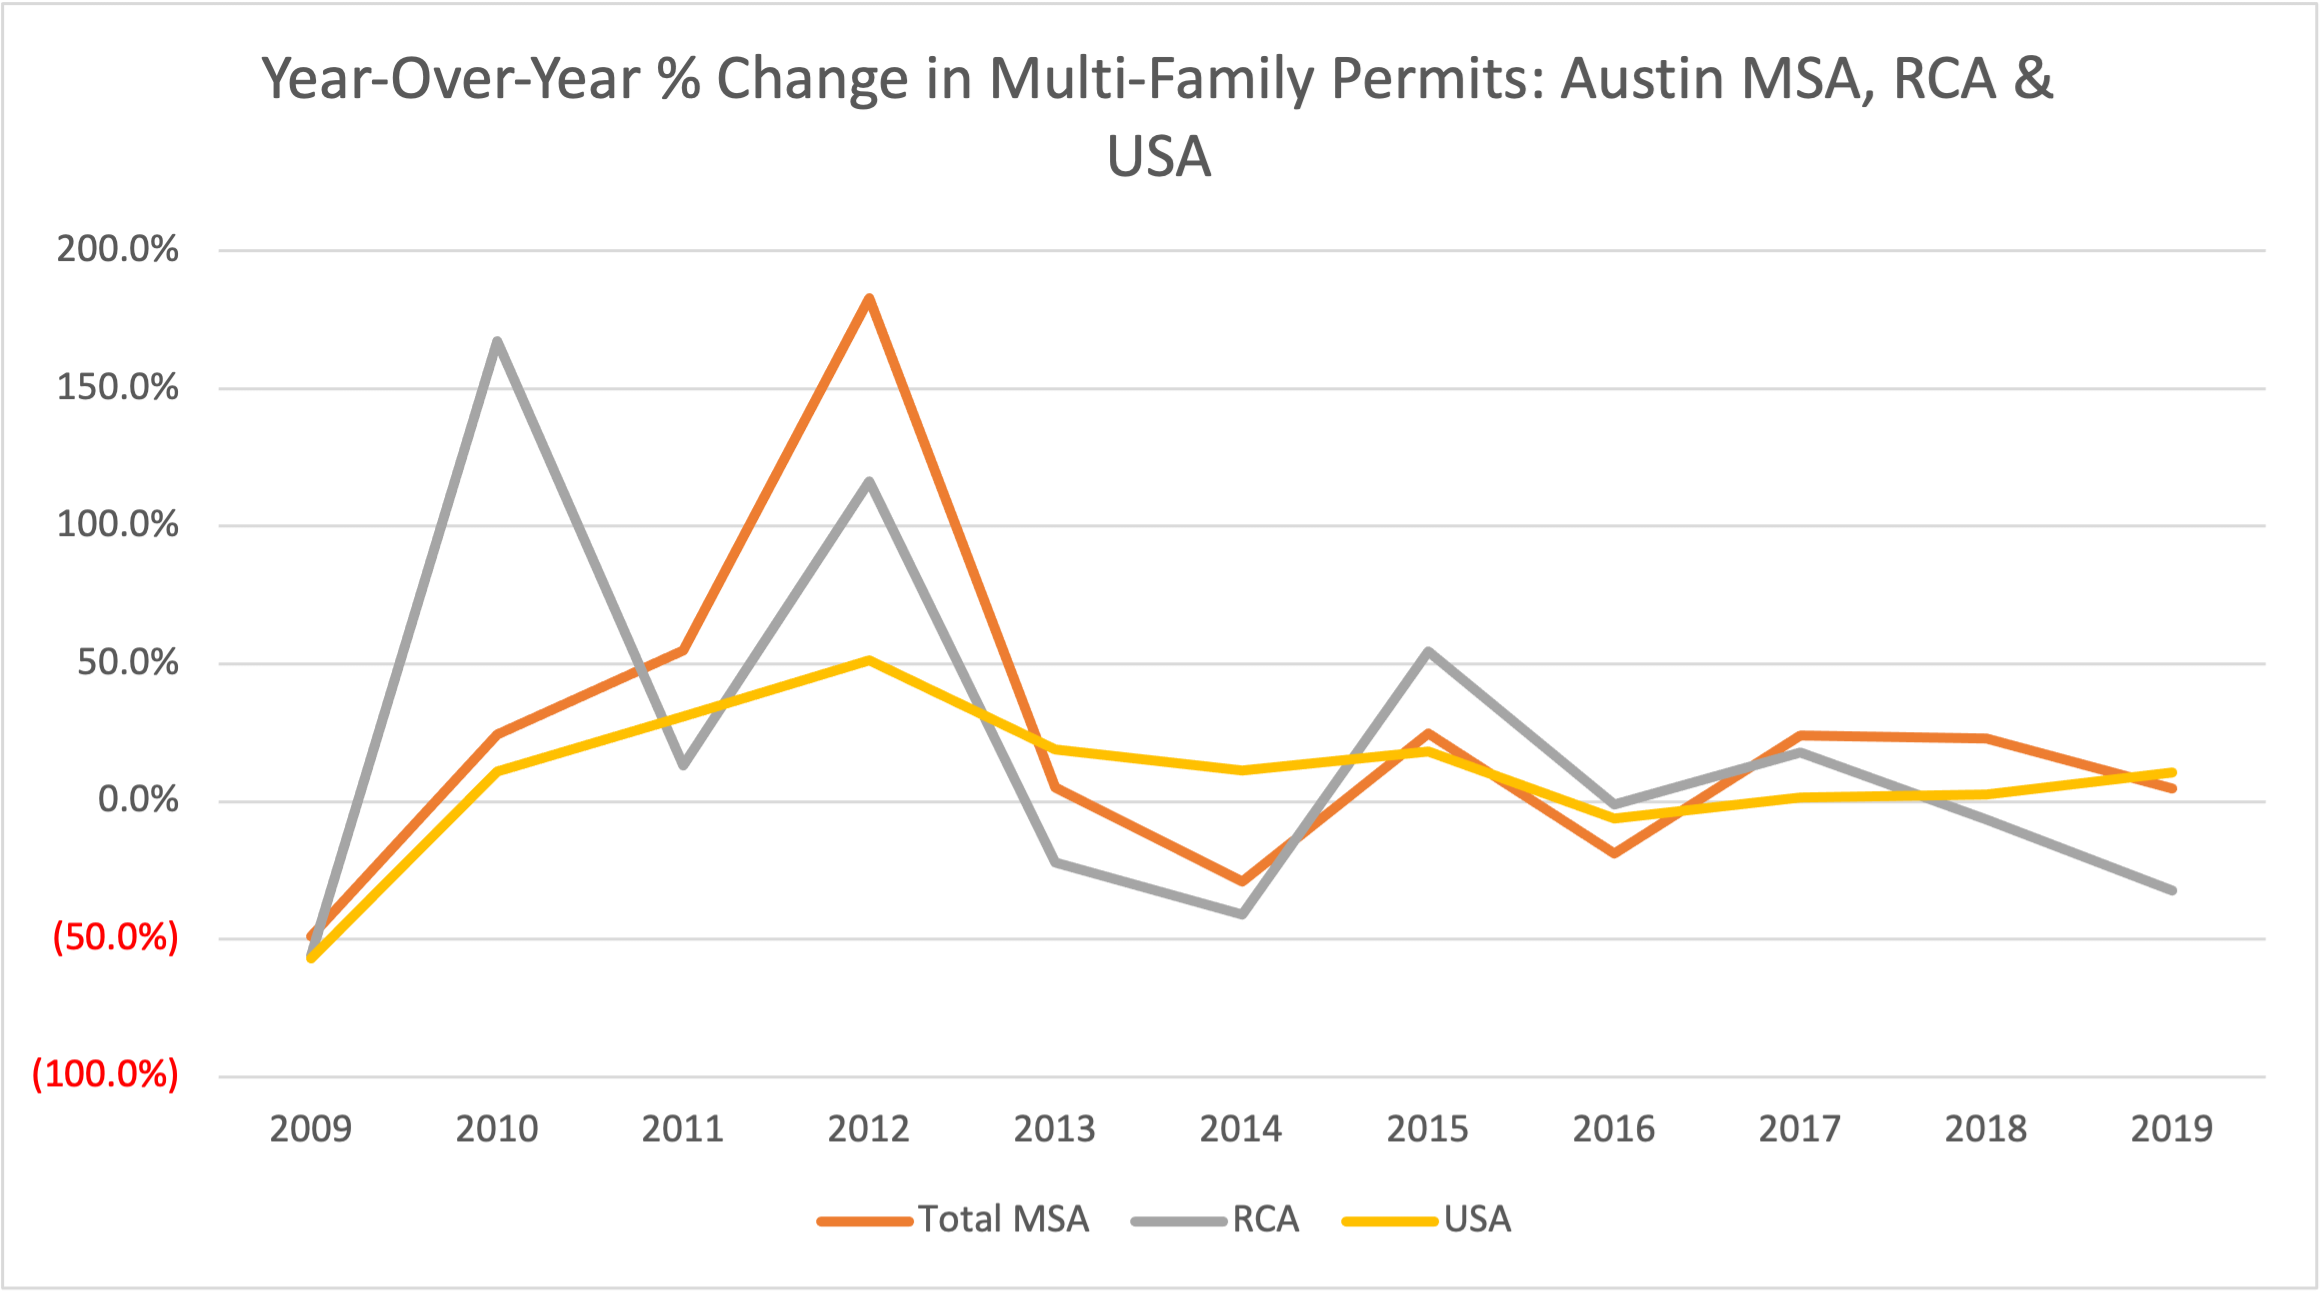
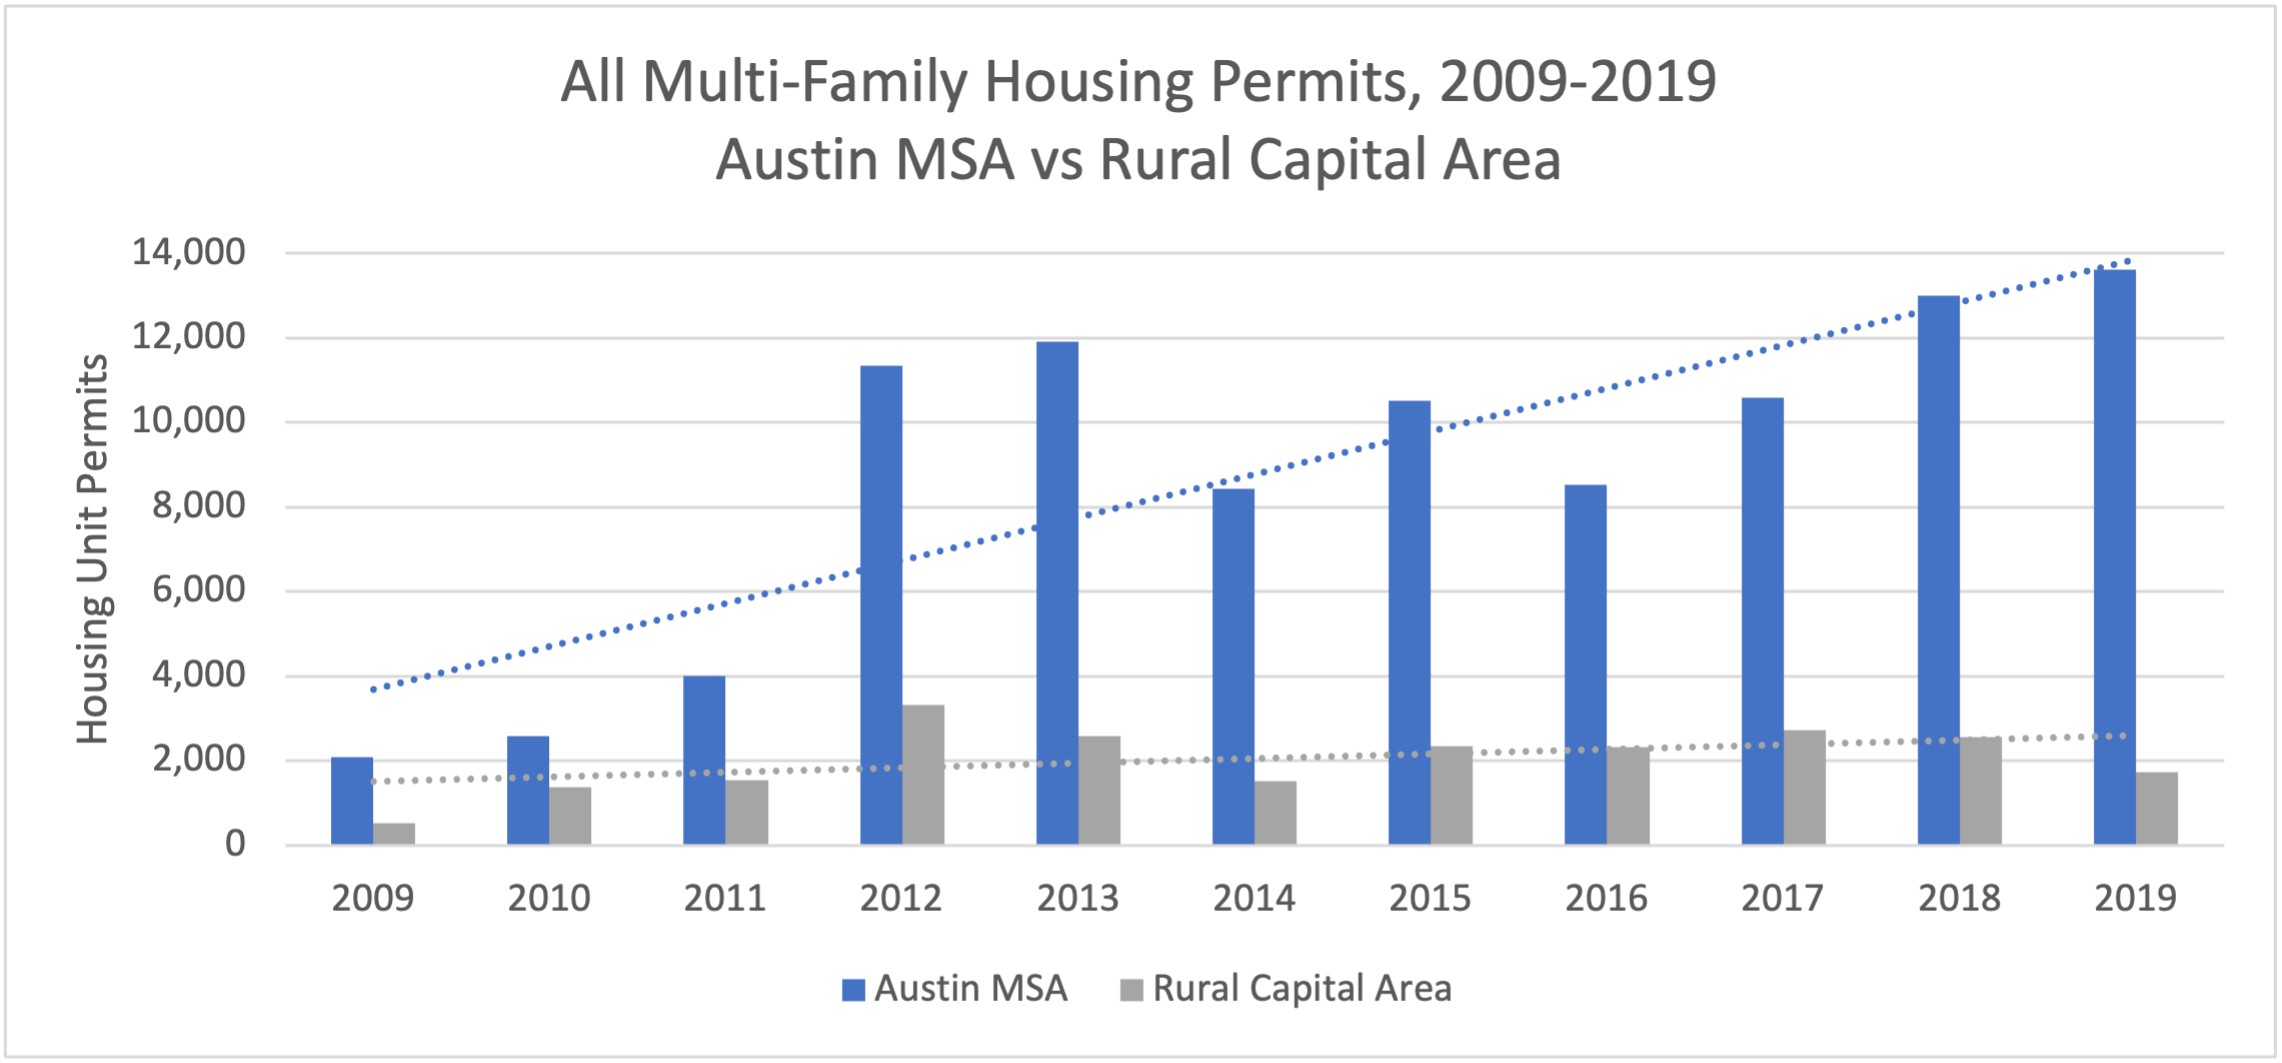
Over the past ten years, multi-family permitting has been relatively uncommon in the RCA while growing considerably in the Austin MSA. 2012 represented a banner year for both regions. Driven by a combination of builders’ confidence and pent-up demand after finally recovering from the Great Recession, multi-family permits boomed. Multi-family permits increased roughly 7,300 in the MSA and roughly 1,800 in the RCA, while at the same time, single-family permits grew at a much more tepid pace. By 2014, authorized permits in the Austin MSA and the RCA dropped by roughly 3,500 and 1,000, respectively. From then on until 2019, multi-family housing permits in the MSA picked back up but continued to be minimal in the RCA, never again reaching the pace set in 2012.
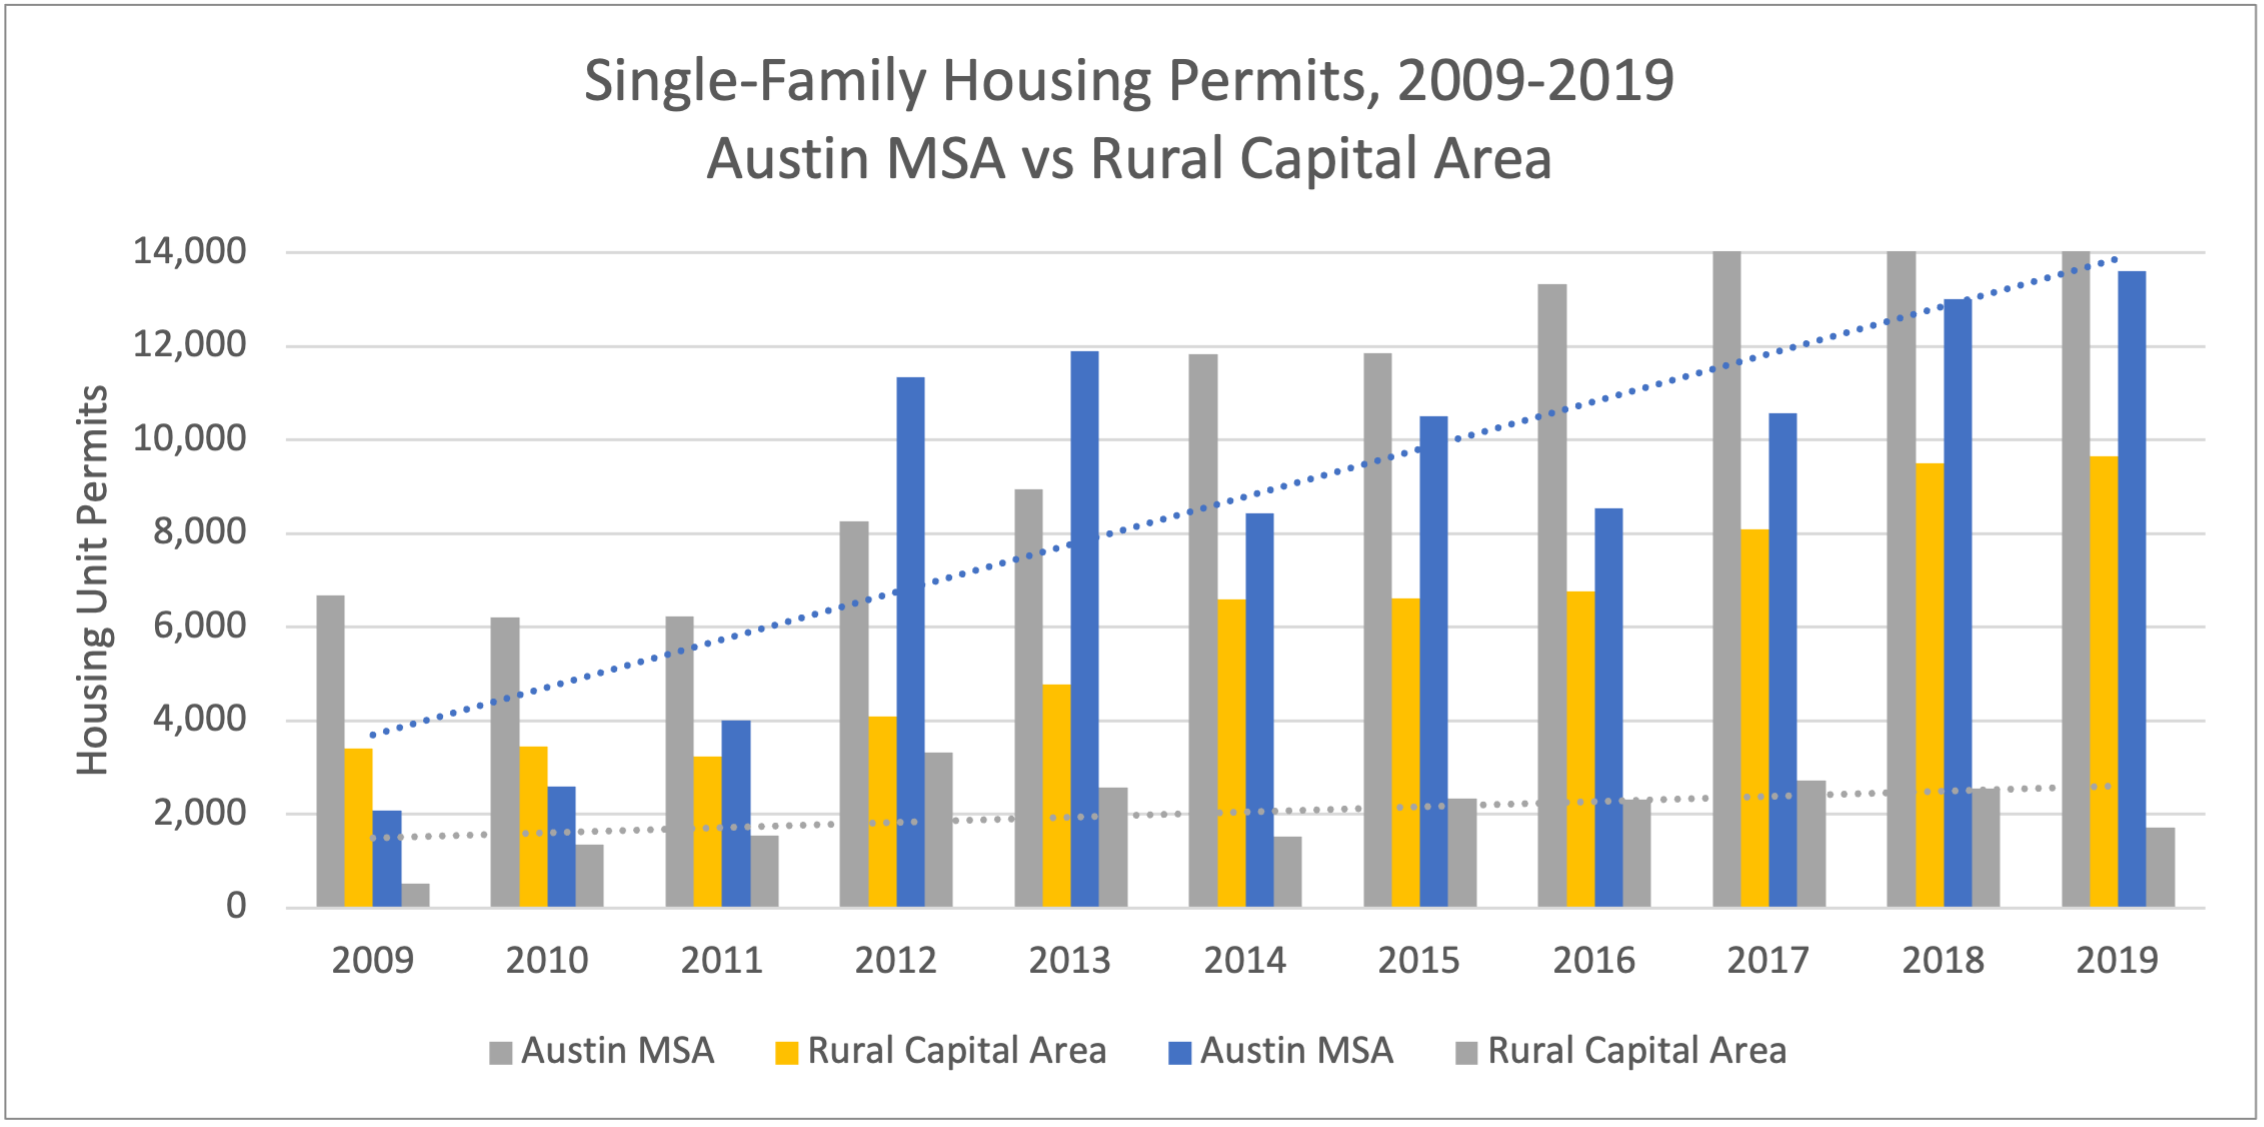
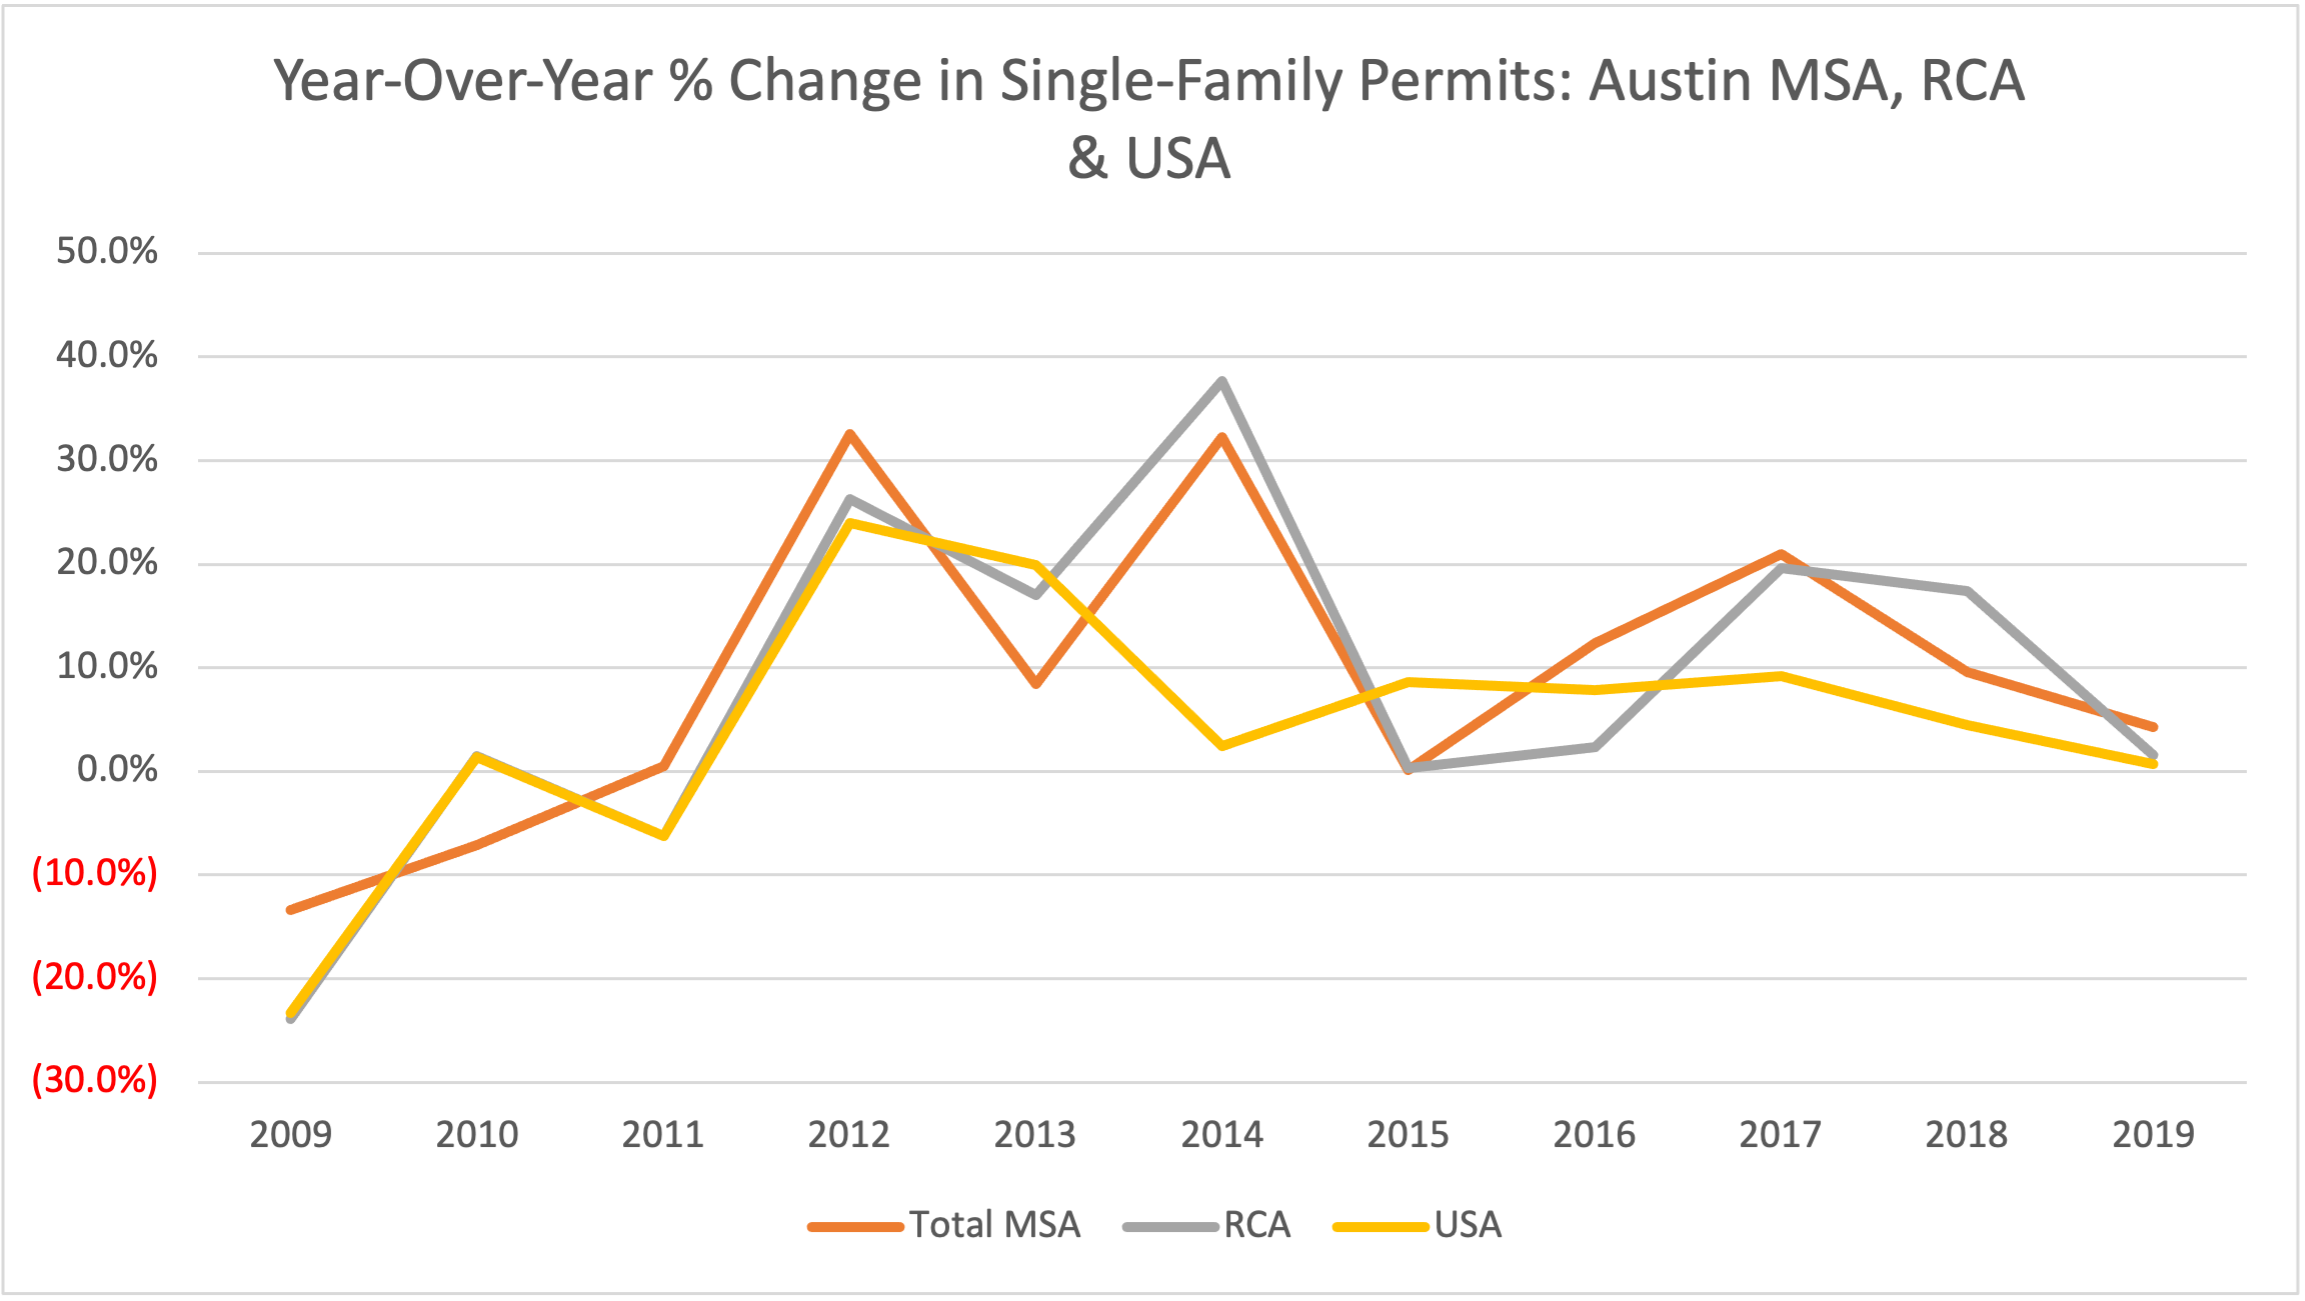
On the other hand, single family permitting continued to flourish over the past decade in both the Austin MSA and the RCA. Permitting trends generally follow the same trendline between 2009 and 2019 within each of the regions. Given the difference in scale between the regions, however, permits typically increase by several thousand in the MSA, and several hundred in the RCA.
As population and economic development increases in Central Texas, each housing unit type in both areas is likely to see continued growth. However, the rates may see dramatic increases or decrease depending on how quickly the units are established and if developments create a supply surplus or shortage.
Within the last 10-year period in permit development, the Austin MSA had volatile spurts of growth whereas the RCA fluctuated. On a year-to-year analysis of the unit permit growth, the MSA had the most notable increase contrasted to the RCA and the nation. In 2012 and 2018 multi-family permitting peaked by 2,242.4% and 5,108.5% on a year over year basis. In 2014 and 2018, single family permits peaked at 1,583.4% and 386.5%.
Time will tell how the effects of COVID on worker migration and building will affect the supply and demand of housing in Central Texas. Permitting in 2019 nearly matched that in 2018, but due to supply and labor shortages, and work stoppages due to COVID, 2020 will likely be a different story.